We ran a standard cotton t-shirt through our PEFCR screening calculator. The result: 2.71 kg CO₂e of climate impact and 24.34 m³ of water usage across its entire lifecycle. Most people assume manufacturing drives the bulk of a garment's environmental footprint. The data tells a different story.
Nearly half of the carbon footprint comes from a phase most brands never think about: the use phase. Washing, drying, and ironing a t-shirt over its lifetime generates almost as much CO₂ as growing and processing the cotton itself. This article breaks down every lifecycle stage, explains where the numbers come from, and shows what brands can actually do about it.
How is the carbon footprint of a cotton t-shirt calculated?
The calculation follows Product Environmental Footprint Category Rules (PEFCR) v3.1 for apparel and footwear. PEFCR is the EU-standardized methodology for measuring the environmental impact of textile products. It will become mandatory under the Ecodesign for Sustainable Products Regulation (ESPR), which requires digital product passports for textiles sold in the EU from 2028.
Our calculation is a screening assessment. It uses secondary data from industry databases rather than primary data from specific suppliers. A screening gives you a reliable estimate of where a product sits relative to industry averages. It does not replace a full PEFCR study with audited primary data, but it reveals the structural pattern of where environmental impact concentrates across a product's lifecycle.
The Data Quality Rating (DQR) of our screening is 1.6, which indicates good overall data quality. DQR scores range from 1.0 (best) to 5.0 (worst), with scores below 2.0 considered reliable for screening purposes.
Important caveat: the numbers in this article are screening results. They represent industry averages, not certified product-specific values. Think of them as a reliable structural map of where impact concentrates, not as auditable declarations.
What does the full lifecycle breakdown look like?
PEFCR divides a product's lifecycle into five stages: materials, manufacturing, distribution, use, and end of life. Each captures specific processes and their associated environmental impacts across 16 impact categories. Here, we focus on two indicators: climate change (kg CO₂e) and water usage (m³).
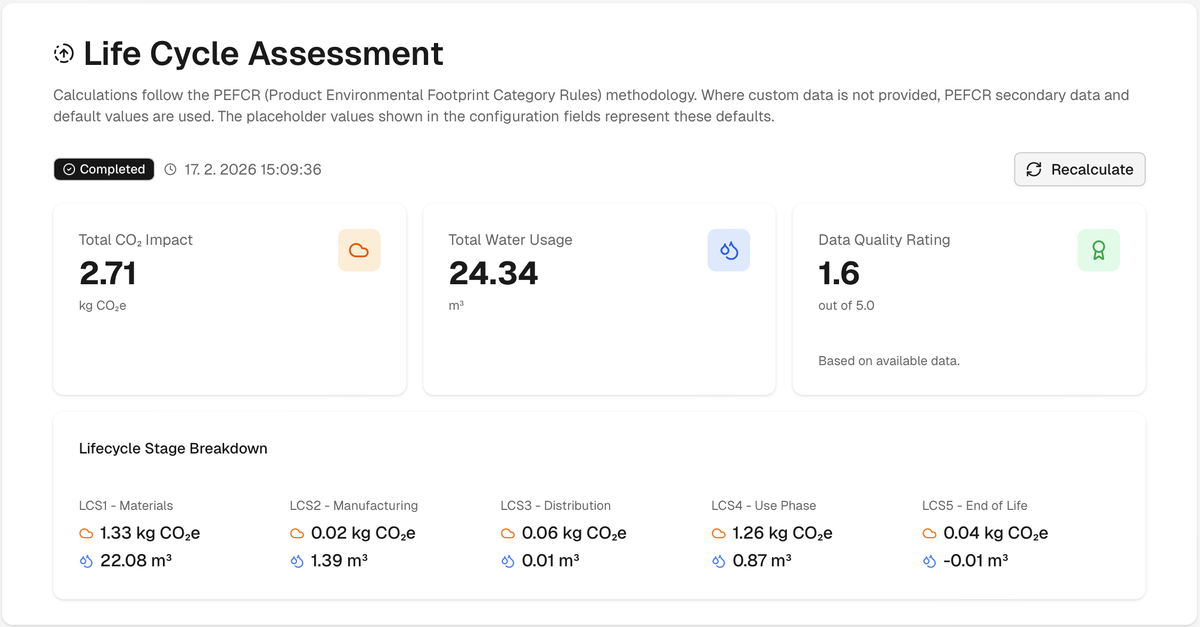
| Lifecycle Stage | CO₂e (kg) | % of Total CO₂e | Water (m³) | % of Total Water |
|---|---|---|---|---|
| LCS1 — Materials | 1.33 | 49.1% | 22.08 | 90.7% |
| LCS2 — Manufacturing | 0.02 | 0.7% | 1.39 | 5.7% |
| LCS3 — Distribution | 0.06 | 2.2% | 0.01 | 0.04% |
| LCS4 — Use Phase | 1.26 | 46.5% | 0.87 | 3.6% |
| LCS5 — End of Life | 0.04 | 1.5% | −0.01 | −0.04% |
| Total | 2.71 | 100% | 24.34 | 100% |
Two stages dominate the carbon footprint: materials (49.1%) and use phase (46.5%). Together they account for over 95% of the total climate impact. Water tells a completely different story — materials alone are responsible for over 90% of the total water footprint.
Key finding: Materials (49%) and the use phase (46.5%) together account for over 95% of a cotton t-shirt's carbon footprint, while manufacturing, distribution, and end of life contribute less than 5%.
Why do raw materials account for half the carbon footprint?
The materials stage (LCS1) generates 1.33 kg CO₂e and consumes 22.08 m³ of water. This covers cotton cultivation, ginning, fiber processing, and yarn production. At 49.1% of total carbon, it is the single largest contributor to climate impact.
The real headline is water. Cotton is one of the most water-intensive crops on the planet. Conventional irrigated cultivation requires 8,000 to 10,000 liters per kilogram of fiber. Our screening shows 22.08 m³ consumed at the materials stage alone — that is 90.7% of the t-shirt's entire water footprint concentrated in one lifecycle phase.
The water impact varies dramatically by growing region. PEFCR accounts for this through Water Scarcity Index characterization factors. Research on cotton cultivation in Pakistan's Punjab province found that water scarcity footprints vary by a factor of two between northern and southern growing regions within the same country. Cotton grown with rain-fed organic methods in Turkey will show fundamentally different water numbers than irrigated conventional cotton from Central Asia.
Organic versus conventional cotton affects more than water. Conventional cultivation involves synthetic fertilizers and pesticides that contribute to eutrophication and ecotoxicity — impact categories captured in PEFCR's full 16-category assessment beyond the two we focus on here. Organic cotton typically reduces climate impact by 20–40% at the cultivation stage, though lower yields per hectare complicate the picture.
Why does the use phase generate almost as much CO₂ as growing cotton?
The use phase (LCS4) produces 1.26 kg CO₂e — the second-largest contributor at 46.5% of total carbon. Nearly half of a cotton t-shirt's lifetime carbon footprint comes from what happens after you buy it. This is the number that surprises most people.
PEFCR models the use phase based on a defined number of washing cycles, drying events, and ironing sessions over the product's expected lifetime. For a standard cotton t-shirt, the functional unit assumes approximately 52 wash cycles. Each cycle involves energy for heating water, running the washing machine, tumble drying (in markets where this is common), and occasional ironing.
The practical implication for brands is significant. A t-shirt designed for lower washing temperatures, fewer wash cycles (through antimicrobial finishes or darker colors), or air-drying compatibility has a genuinely lower measured carbon footprint. This is not a marketing claim. It is a quantifiable reduction under PEFCR methodology.
PEFCR also introduces a critical concept: the per-use footprint. The functional unit incorporates product lifetime. A t-shirt rated for 100 washes has roughly half the per-use carbon footprint of one rated for 50 washes, assuming identical materials and care instructions. Durability is a direct lever on measured environmental performance.
For more on how product lifetime connects to EU circular economy requirements, see our article on circular economy in textiles and EU regulations.
Key finding: A t-shirt with twice the lifespan has roughly half the per-use carbon footprint, making durability the single strongest lever on measured environmental performance.
Want to know where your product stands? We'll run a free screening of your bestseller →
Why is the manufacturing footprint so low in a screening?
Manufacturing (LCS2) shows just 0.02 kg CO₂e — less than 1% of total carbon. Cutting, sewing, dyeing, and finishing a garment involves real energy consumption. So why is this number so small?
Screening uses averaged secondary data from industry databases. These averages smooth out the enormous variation between factories. A garment sewn in a facility powered by hydroelectricity in Portugal will have a radically different manufacturing footprint than one produced in a coal-powered factory in Bangladesh.
In a full PEFCR study with primary data, manufacturing typically accounts for 15–25% of total carbon. The 0.7% in our screening is an artifact of averaging, not a reflection of reality for any specific product. This is precisely where sustainable brands can differentiate themselves: better factories, cleaner energy, more efficient dyeing processes. But those advantages only become visible in a full assessment with factory-specific data.
The same applies to water. Our screening shows 1.39 m³ for manufacturing, but wet processing (dyeing, washing, finishing) is notoriously water-intensive. A factory with closed-loop water recycling will perform dramatically differently from one discharging wastewater directly. Primary data reveals these differences; screening averages hide them.
How much does transportation actually contribute?
Distribution (LCS3) accounts for 0.06 kg CO₂e, or 2.2% of total carbon. This challenges a widespread assumption. Many consumers believe shipping garments across the world is a major environmental problem. The data shows it is a relatively minor contributor compared to materials and use.
The mode of transport matters, though. Ocean freight generates roughly 10–40 grams of CO₂ per ton-kilometer. Air freight produces 500–1,000 grams — a 10–25x multiplier. A t-shirt shipped by sea from Asia to Europe adds minimal carbon. The same t-shirt air-freighted to meet a tight delivery deadline could multiply the distribution footprint by an order of magnitude.
For most standard supply chains, distribution is not the first lever to pull. Materials and use phase offer far larger reduction opportunities.
What happens at end of life?
End of life (LCS5) contributes 0.04 kg CO₂e and shows a negative water value of −0.01 m³. The negative water figure represents a recycling credit: material recycled at end of life partially offsets the water consumed in producing virgin material.
PEFCR v3.1 models end of life using the Circular Footprint Formula (CFF). The CFF allocates environmental burdens and credits between the product system and the next life of the material. It accounts for recycled content going in, recyclability at end of life, and quality factors that distinguish true fiber-to-fiber recycling from downcycling into lower-value applications like insulation or rags.
Today, only about 1% of used clothing is recycled into new clothing globally. Most textile waste ends up in landfill or incineration. Brands with take-back programs and design-for-recyclability strategies can improve their CFF scores. The improvement is small in absolute terms (end of life is 1.5% of total carbon), but becomes more significant as recycling infrastructure scales and ESPR mandates recycled content targets.
For more on how circularity requirements connect to the broader EU textile strategy, see our article on circular economy in textiles.
What does this mean for textile brands?
Three insights emerge from the data.
Materials and use phase are the two biggest levers. Together they account for 95.6% of total carbon. A brand serious about reducing its product footprint should focus here first: sourcing lower-impact fibers and designing for reduced washing frequency and lower-temperature care. Transportation and packaging are marginal contributors.
Screening gives you the pattern. Primary data gives you the differentiation. Our screening result of 2.71 kg CO₂e aligns with industry benchmarks. A 2025 study running 10,000 Monte Carlo simulations found a median t-shirt footprint of 3.01 kg CO₂e with a P10–P90 range of 2.12–4.12 kg CO₂e. The screening tells you where the average product sits. A full PEFCR study with primary data from your specific suppliers typically shows 20–40% lower impacts for brands with genuinely better supply chains.
Product lifetime is a hidden multiplier. PEFCR calculates impact per functional unit, which incorporates use cycles. If your t-shirt lasts twice as long, its per-use footprint drops roughly in half. Investing in fabric quality, reinforced seams, and colorfastness is a measurable environmental improvement that shows up directly in PEFCR calculations.
How does a screening compare to a full PEFCR assessment?
| Aspect | Screening | Full PEFCR |
|---|---|---|
| Data source | Secondary (database averages) | Primary (your suppliers, your factories) |
| Time to complete | Minutes | Weeks to months |
| Accuracy | ±30–50% of actual values | ±10–15% with verified data |
| Cost | Low (automated tools) | Significant (data collection, verification) |
| Use case | Quick benchmarking, hotspot ID | Compliance, green claims, DPP data |
| Auditability | No | Yes, third-party verifiable |
| ESPR compliance | Not sufficient alone | Required for environmental footprint declarations |
Key finding: A screening reveals the structural pattern of impact in minutes, but only a full PEFCR study with primary data enables auditable environmental claims and ESPR compliance.
Think of a screening as a BMI measurement. It tells you roughly where you stand relative to the population. A full PEFCR is a comprehensive blood panel. It tells you exactly what is happening and where to intervene.
The screening is where every brand should start. It identifies which lifecycle stages matter most for your specific product category and material mix. The full PEFCR is where you go when you need auditable data for compliance, credible environmental claims, or digital product passport data under ESPR.
For a deeper look at PEFCR data hierarchy and the difference between credible environmental claims and greenwashing, see our article on verifiable sustainability.
FAQ
What is the average carbon footprint of a cotton t-shirt?
Industry benchmarks put the median at approximately 3.0 kg CO₂e, with a typical range of 2.1–4.1 kg CO₂e depending on material sourcing, manufacturing location, and end-of-life treatment. Our PEFCR screening returned 2.71 kg CO₂e for a standard cotton t-shirt, sitting in the lower half of the range.
Why is the use phase footprint almost as high as materials?
Washing, drying, and ironing over approximately 52 cycles requires significant energy. Heating water, running appliances, and tumble drying generate CO₂ tied to the local electricity grid. In our screening, the use phase accounts for 1.26 kg CO₂e (46.5% of total).
How much water does producing a cotton t-shirt consume?
Our screening shows 24.34 m³ total, with 22.08 m³ (90.7%) in the materials stage. Cotton cultivation requires 8,000–10,000 liters per kilogram of fiber under conventional irrigation. The actual water scarcity impact depends heavily on the growing region's Water Scarcity Index.
Can a brand reduce carbon footprint without changing materials?
Yes. The use phase accounts for 46.5% of total carbon. Designing for lower washing temperatures, reduced wash frequency (antimicrobial treatments, stain-resistant finishes), and air-drying compatibility measurably reduces the footprint. Extending product lifetime also halves the per-use impact under PEFCR's functional unit.
Will PEFCR become mandatory for textile companies?
PEFCR is the designated methodology for environmental footprint calculations under ESPR. From 2028, textile products sold in the EU will need digital product passports with environmental performance data calculated using PEFCR. A detailed timeline is available in our guide to DPP compliance.
What is the Circular Footprint Formula?
The CFF is the PEFCR v3.1 method for modeling end-of-life impacts. It allocates burdens and credits between the current product and the next life of recycled material, accounting for recycled content input, recyclability at end of life, and material quality degradation across recycling loops.
What should you do next?
Every product has a footprint. The question is whether you know where it comes from.
- Try our screening calculator — get a first estimate in under a minute: total climate impact, water footprint, and a stage-by-stage breakdown. Run a screening →
- Read our DPP compliance guide — how to prepare for mandatory digital product passports from 2028. Go to the guide →
- Book a free consultation — your first screening report is on us. Contact the cyrcID team →
cyrcID builds digital product passport software for the textile industry, including integrated environmental footprint tools that follow PEFCR methodology. Whether you need a quick screening or a compliance-ready full assessment, we help you turn environmental data into a competitive advantage.